
Introducing Pass Clustering
Uncovering hidden patterns in passing data

At Laduma Analytics, our goal is to go beyond “providing stats” and surface-level number crunching. While pass counts and pass maps have their place, especially in storytelling, we use data science techniques to develop innovative metrics and models that deliver deeper, more meaningful insights for analysts. Pass maps and heat maps may tell us where players pass the ball, but they don't show deeper player and team patterns. Pass clustering is a model that can help identify & analyse patterns of play.
What is clustering?
“Clustering is a data analysis technique that groups similar data points while separating dissimilar ones, revealing hidden patterns in large datasets.”
There are different methods you can use for clustering to determine what the optimal number of clusters is - do you want two distinct groups of data or 10 or “k”? We used a method known as k-means, which divides a set of data points into “k” mutually exclusive clusters. Clustering is used across many fields, notably in corporate and advertising environments, where businesses analyse customer data to identify purchasing patterns and deliver customised marketing content or product offerings that align with user preferences.
Clustering passes.
When applied to football, clustering can help us analyse huge data points, including the most common type of event that occurs during a football match - passing. On average, a PSL game produced 780 passes last season. Players average 44 passes per game, and there were 14 occasions last season where individual players attempted 100+ passes. Pass clustering can help us identify signature passing patterns for players and teams. Through clustering, we can isolate players’ and teams’ passing tendencies (distance of pass, frequency and direction/source of line-breaking passes, etc).
An example: Fawaaz Basadien
New Sundowns recruit, Fawaaz Basadien, is one of 10 players who completed 1,000+ passes throughout last season. Visualising all his passes to make sense of patterns with such a large sample of games can become difficult. This is one way:
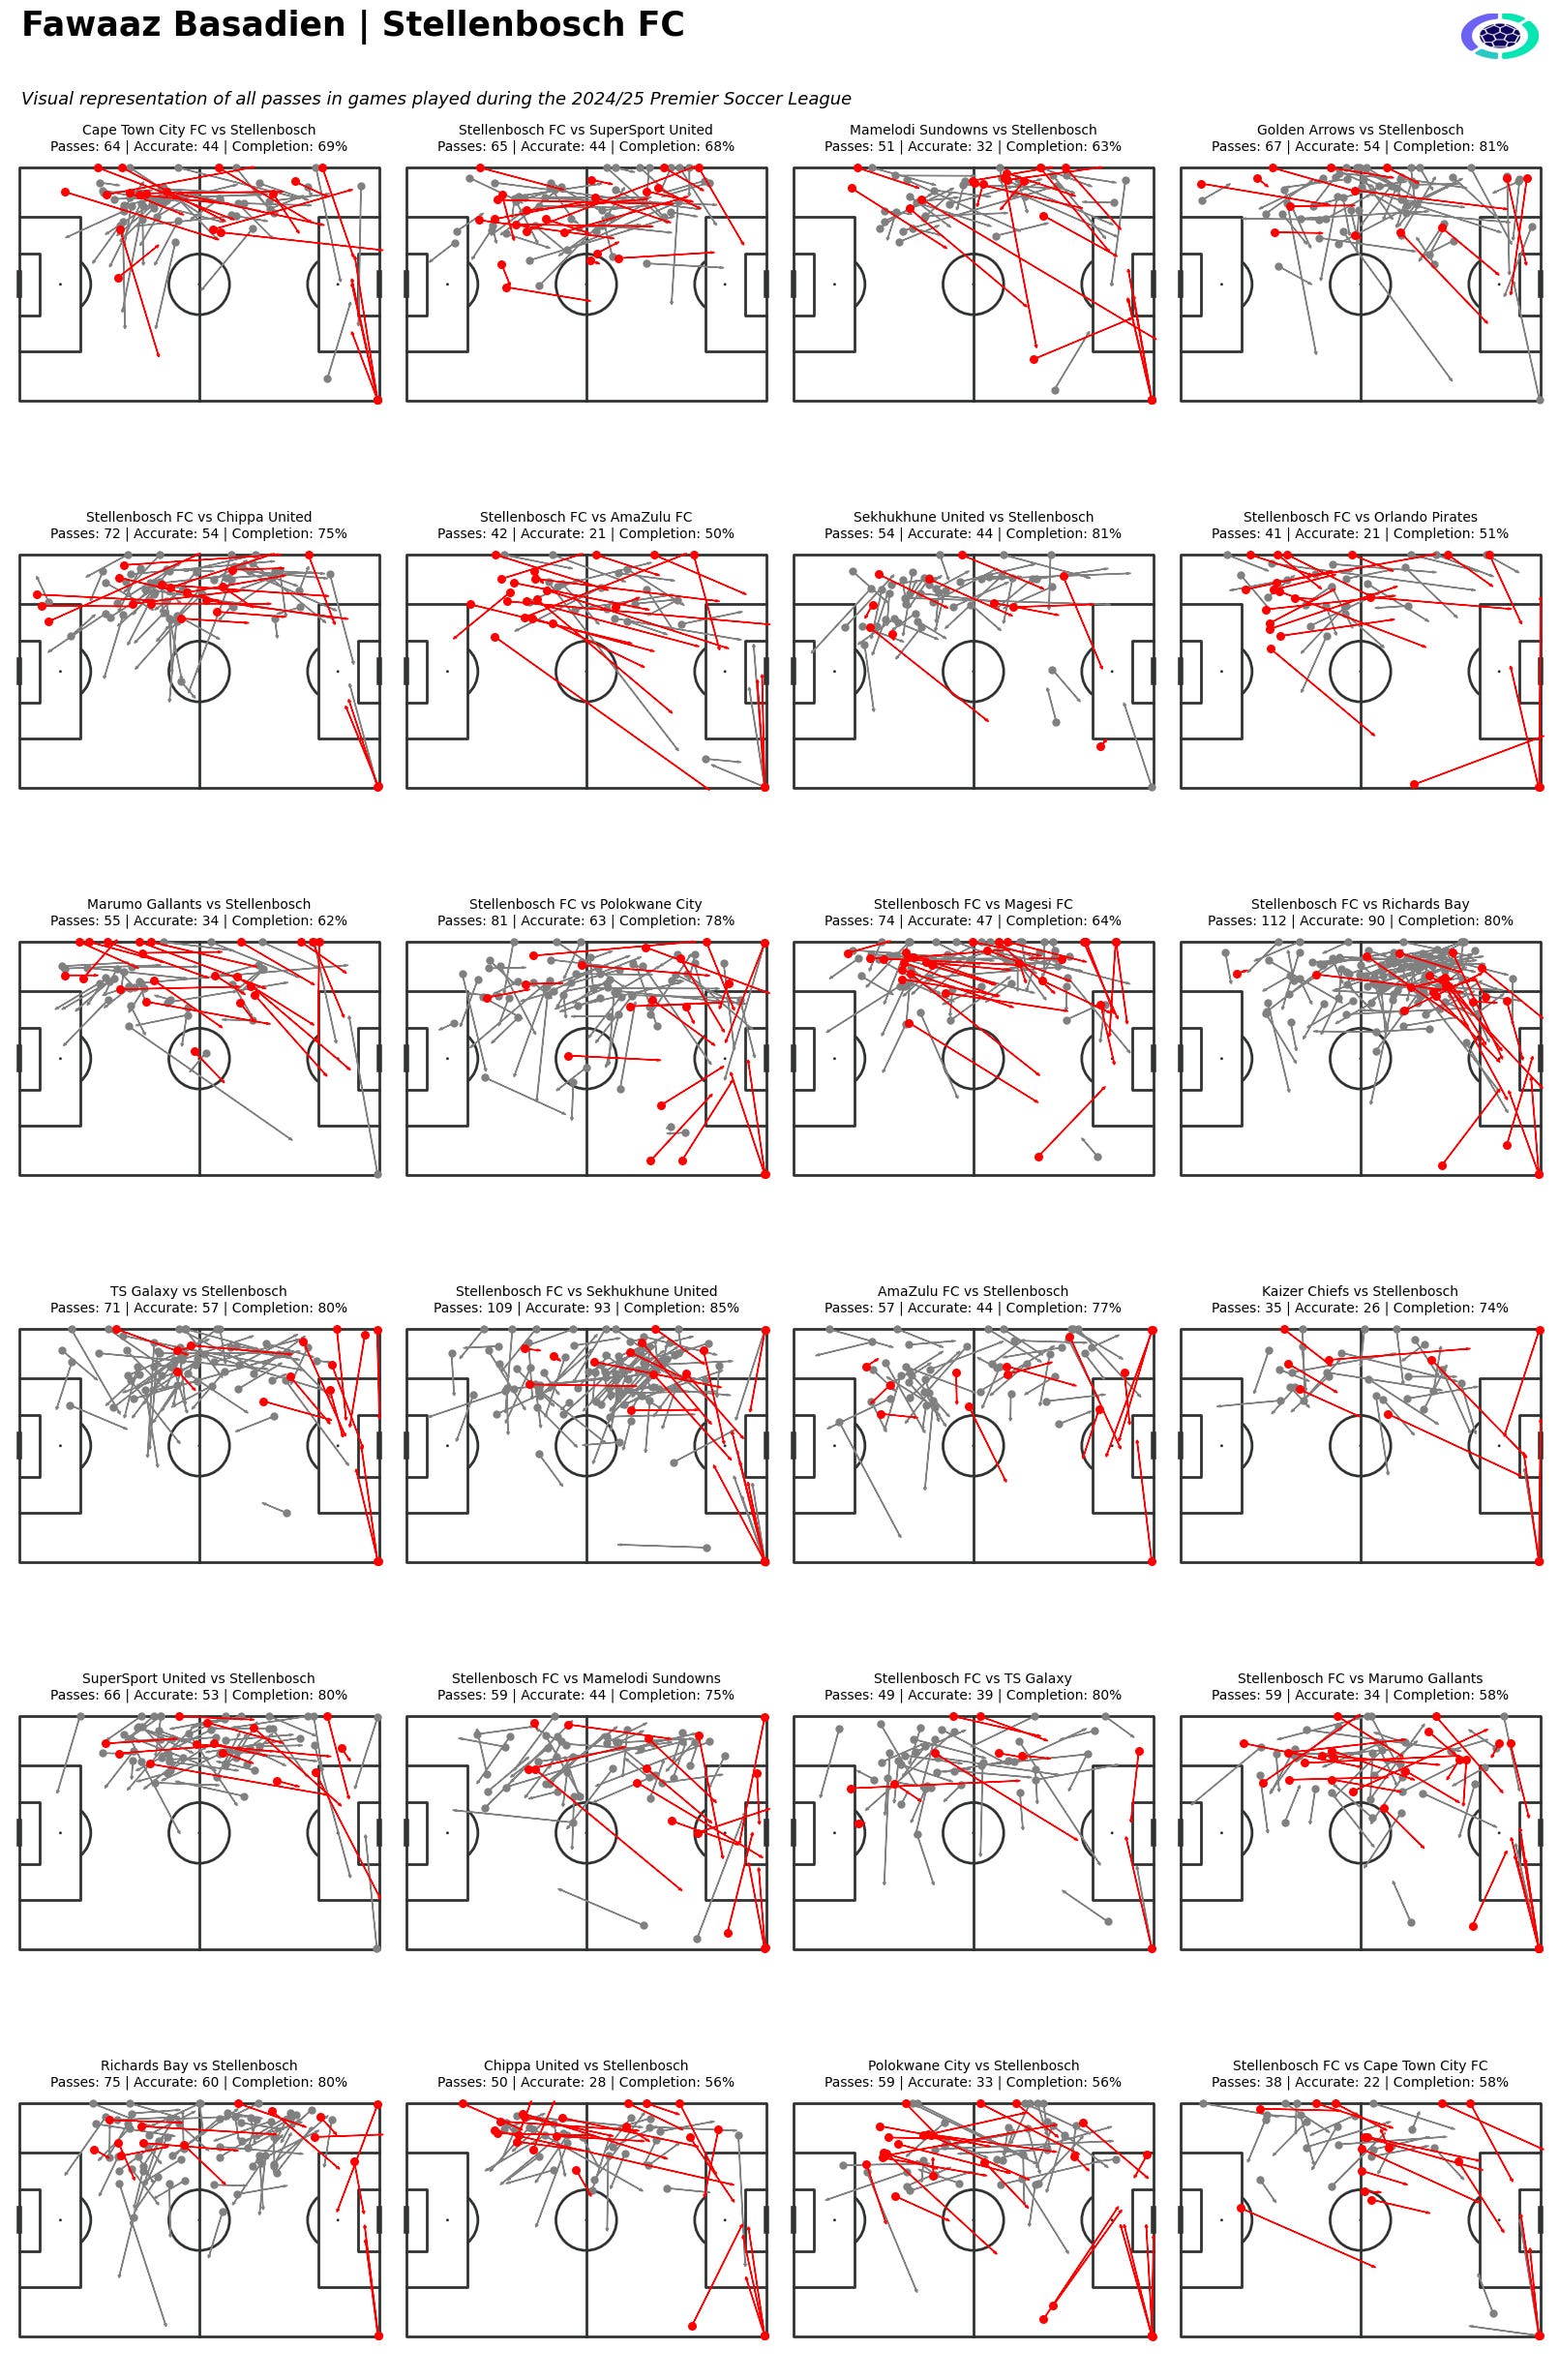
But this multi-game pass map only separates passes by individual games, rather than using clustering algorithms to group passes by their actual characteristics, such as length, direction, or situation. Clustering helps with the latter.
Pass clustering is even more valuable when paired with other metrics. For example, a team may go through their video analysis process and shortlist their next opponents’ most dangerous players. Then they can look at our Expected Threat model and see the most dangerous passer on that team. Combining video analysis and xT with pass clustering can show more of HOW that player created value, identifying which passes are most dangerous. Clustering adds another layer of information around pass patterns and locations that generate the most threat.
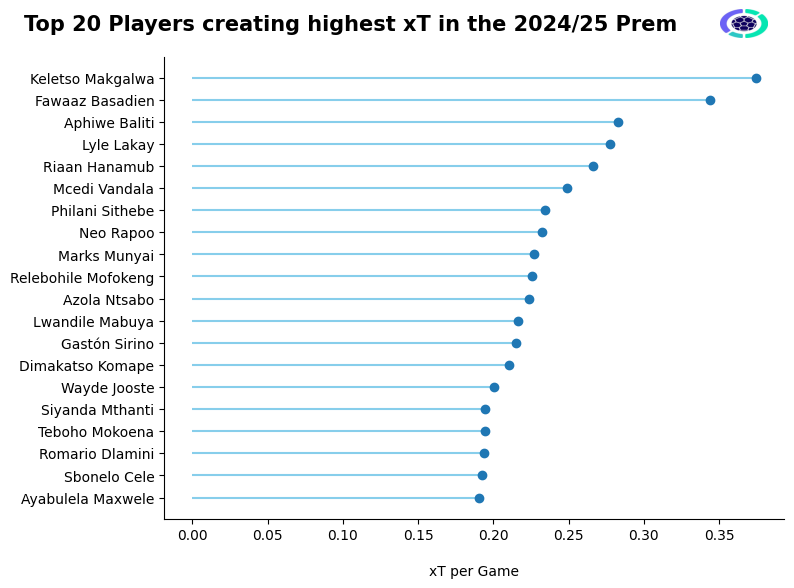
Basadien was the 2nd most valuable passer last season, and we have clustered his passes from last season into six distinct groups/patterns, helping us understand the nuances of his passing repertoire.
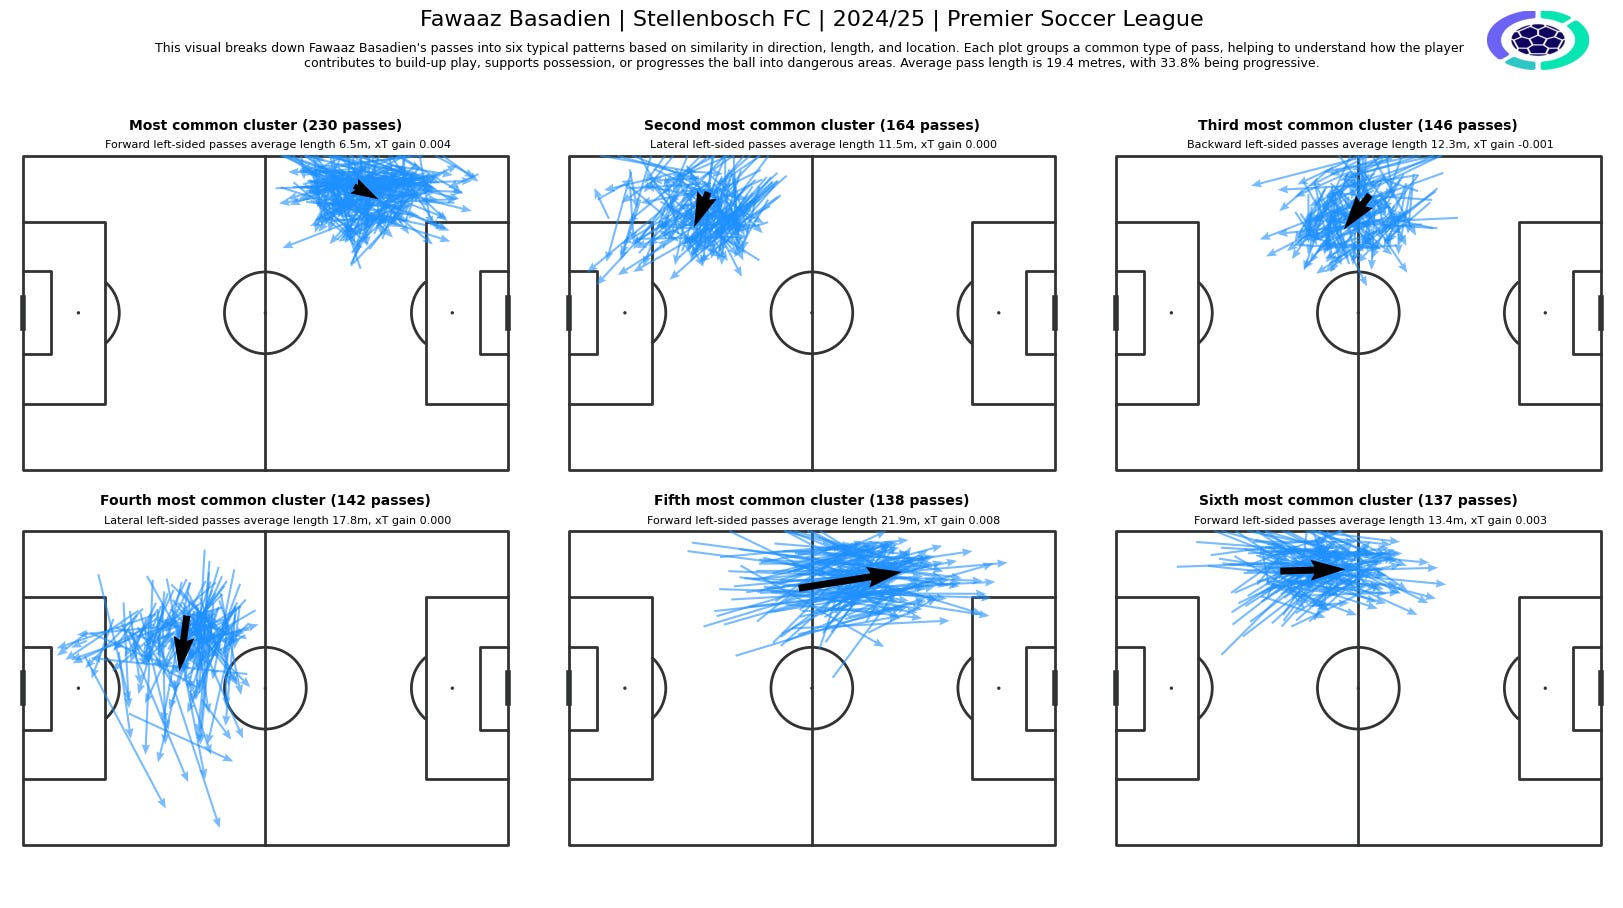
From this, we see three initially interesting clusters.
Most common cluster (230 passes): Short forward passes on the left, around 6.5m in length. These were mainly used in link-up plays, aiding ball retention and progression in tight zones.
Second cluster (164 passes): Lateral switches across the left wing, averaging 11.5m, indicative of how he recycles the ball intelligently to reset or retain structure.
Fifth cluster (138 passes): Perhaps the most impactful, with forward passes averaging 21.9m and an expected threat (xT) gain of 0.008. These entries are incisive and goal-oriented.
Overall, 34% of Basadien’s passes are classified as progressive, and the average pass length stands at 19.4 metres, reinforcing his vertical style of play. Importantly, his most valuable passes in terms of xT come from deeper zones, suggesting he possesses the vision and execution to affect the game long before the final ball. That sounds like words coming straight from a Sundowns playbook.
What He Brings to Sundowns
Basadien’s hybrid profile, part playmaker, part traditional full-back, aligns with Sundowns' evolving tactical approach. Whether operating as a high-and-wide outlet in a back four, or as a left-sided centre-back or wing-back in a back five, he offers:
Ball progression under pressure through forward or lateral passes
Attacking support evidenced by final-third entries and chance creation
Tactical flexibility with the ability to contribute in settled possession/transition
Set-piece threat supported by his chance creation and xT indicators
Other applications
Clustering has potential applications in other areas, including player recruitment, opposition analysis, set-piece analysis and more:
Player recruitment - Finding players with the right passing style to fit a team or coach's specific tactics
Opposition analysis in build-up - Spotting how rival teams like to build up their attacks so a team can make a plan to counter them
Set-piece analysis - Grouping corner kicks and free kicks by delivery type to identify the most dangerous routines
Line-breaking passes - Identify patterns in passes that split defensive lines to create high-value scoring opportunities
And more…
Are you a PSL club looking to turn data into tactical insights for player recruitment, opposition analysis and performance appraisal? Contact us to get started: info@ladumaanalytics.co.za