
Beyond Ball Possession: The Case for Field Tilt
Another (better) way to measure "dominance"?

“We dominated them” is one of the most common post-match claims in football. Coaches, pundits and fans use the term in equal measure - but what does dominance actually mean? And how can we measure it? Normally, ball possession is most commonly used - if a team has more of the ball, it is assumed they dominated the game. Even shot counts have been used to describe dominance, and lately, xG has also entered the chat. None of these are wrong, but they all often lack crucial context. A team can see more of the ball while recycling possession in their own half. A team can take more shots, but mostly from long distances, after trailing. You may win the xG battle in a single game, but the limitations of xG are well documented - in this case, xG from shots taken in counter-attacks may have higher values because the opposition defensive lines are stretched. Field tilt attempts to address some of these gaps by going beyond simple possession and also considering territorial control and attacking intent.
What is field tilt?
Put simply, field tilt is a metric that measures the ratio of a team’s final third touches compared to total final third touches in a game.
Formula: Field Tilt = A team’s final third touches ÷ Total final third touches in a game × 100
Example: Say a PSL game has 100 combined final third touches and Team A has 80, while Team B has 20. Team A has an 80% field tilt [80 ÷ 100 x 100].
It’s a simple formula, but it can be a powerful proxy for understanding territorial control and dominance by a team in a match (from a quantitative perspective). Like any metric, it is not perfect and will have to be used in conjunction with other metrics to get a fuller picture.
Examples
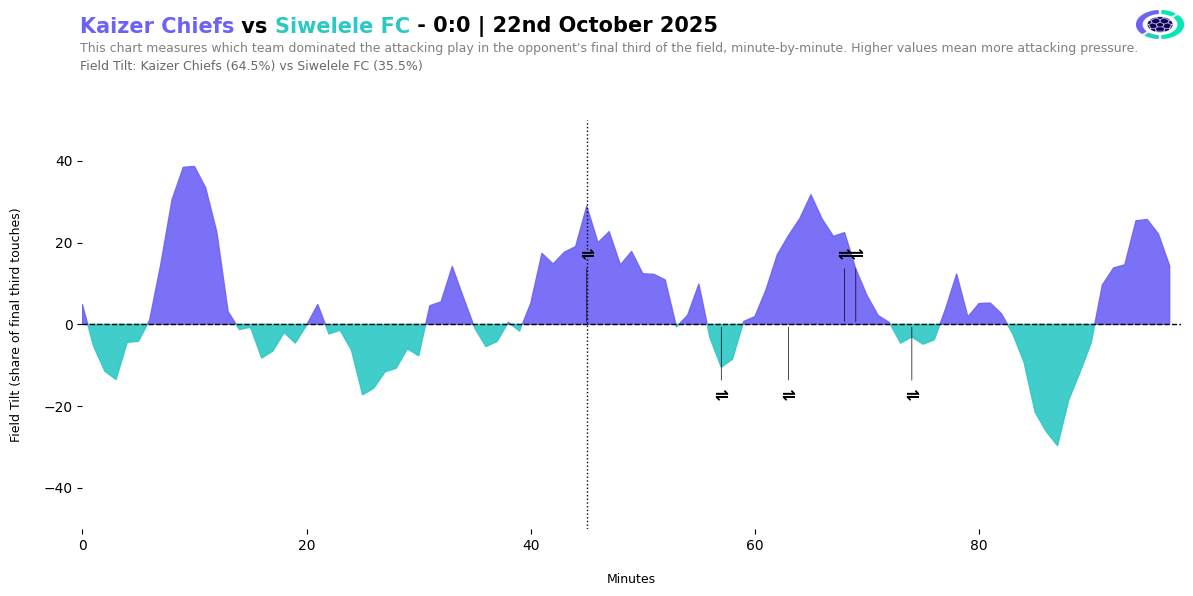
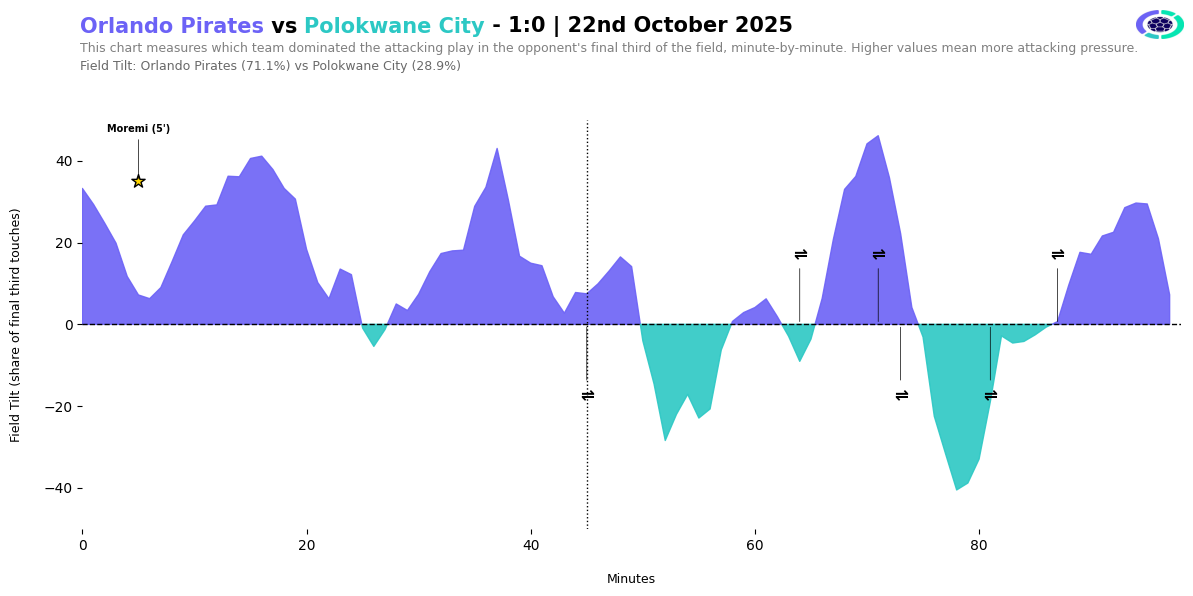
To help illustrate this point further, let’s look at the three midweek games in the PSL. What makes these interesting to use is that they had wildly different outcomes - a drab 0-0, a textbook 1-0 win (the most common scoreline in the PSL) and a chaotic 4-3 thriller. The visuals tracked the field tilt across each game, and we used the Savitzky–Golay filter to smooth out some noise (or else we’d have a spiky, unreadable chart).
Kaizer Chiefs posted a 65% field tilt, with sustained attacking third pressure, mostly in the second half. They camped in Siwelele’s defensive third for periods - dominating attacking territory - even if the possession figures (55% - 45%) don’t fully reflect that.
Pirates’ 1-0 win was more authoritative on many fronts - 64% possession to 36%, more than double the shots, five big chances to zero and a commanding 71% field tilt. The real surprise is how they did not win more comfortably, despite overwhelming the opponent.
The 3rd game of the evening was a seven-goal thriller at Athlone Stadium in Cape Town. Arrows edged both possession and field tilt, though the teams were hard to separate on goals (4-3), xG (2.3-2.2) and shots (6-5).
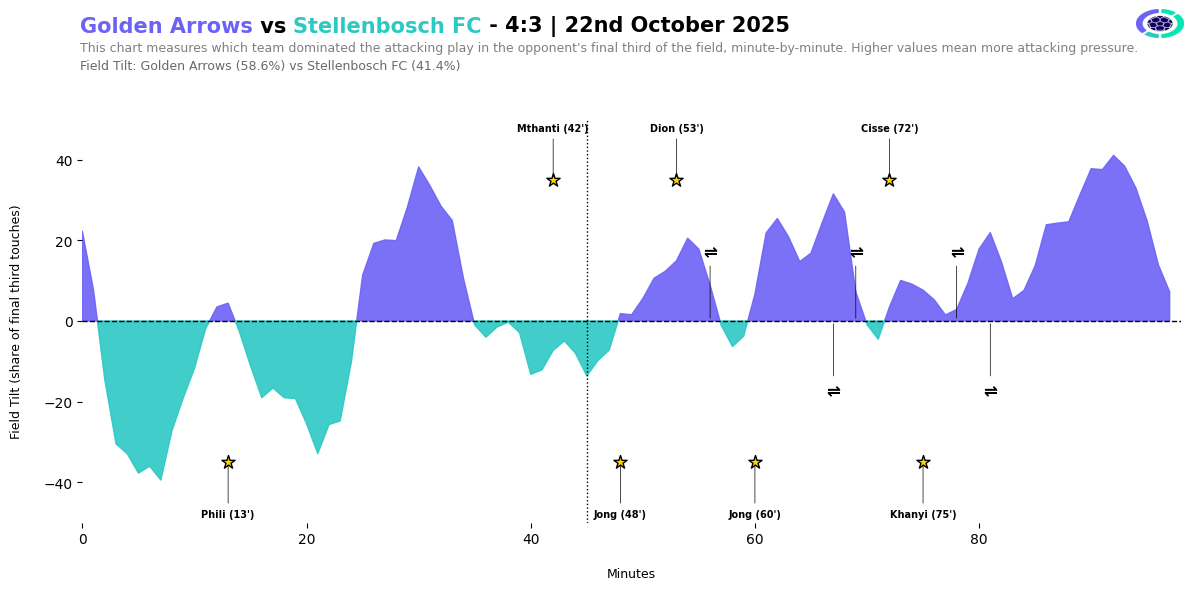
Yet, from the above, one can also see how Arrows’ field tilt spiked when trailing (or how the Stellies’ tilt decreased when protecting leads). Field tilt swings can also show us if teams drastically change how they play when ahead or trailing.
Qualitatively, a higher field tilt is not inherently good or bad, and doesn’t say a team player well or poorly. Context matters. For example, some teams might only plan to have limited possession (say 33%), but enjoy 50% field tilt, suggesting efficient ball progression into dangerous areas despite less time on the ball. Less tilt is from an intentional approach, and is not a symptom of being dominated.
How can it be used
Beyond revealing attacking intent and dominance in matches, field tilt also has tactical implications. It can be used to identify in-game swings in momentum, break down opposition strategies and in pre- & post-match team analysis. More importantly, it should be used as a complimentary to other metrics and video analysis because, as a standalone, field tilt has limitations - quantity of touches alone is not as valuable as quality of touches, teams that depend on direct transitions may not have (or need) as many final third touches to get to goal, and it can undervalue low-block teams whose threat comes from efficiency, not territorial dominance. More compact defences can enable some teams to have quicker direct transitional attacks, meaning they reach the final third quickly when they regain possession.
In future
One can also have a table of overall field tilt for teams in a season, and the more attacking teams would be top of the table in this metric because they have more of the ball in attacking areas. A team like Sundowns is known for sustained possession in the final third. Likewise, it can be an interesting way to explore the change in a team’s territorial profile over time or how coaching changes affect this.
Individual teams will need to look at the relationship between field tilt and results - one cap won’t fit all. Do you generally win more often with a higher tilt? Does lower tilt suit your counter-attacking identity? Are your transitions effective enough to compensate for less territorial control? And more
For PSL teams, these are questions worth answering, and the answers are hidden in the data. To explore field tilt analysis for your team, get in touch via email: info@ladumaanalytics.co.za 📧